Introduction
By the time a weekly sales report lands in your inbox, the window to act on it has often already closed. A sales rep quotes a price that was updated two days ago. A buyer reorders a product that's been sitting in the warehouse for weeks. A credit manager misses a follow-up because AR aging data is five days stale.
Each of those gaps is a direct revenue leak — and they're routine for distributors and wholesalers still running on spreadsheet exports and disconnected systems.
Real-time ERP analytics closes those gaps by surfacing live metrics — sales orders, inventory levels, receivables balances, gross margins — pulled directly from the ERP database as each transaction posts.
This article covers what real-time analytics actually means inside an ERP, why delayed data carries a higher cost than it appears, which business areas it transforms most, and what features to prioritize when evaluating systems.
Key Takeaways
- Real-time ERP analytics draws from the live transaction database—not scheduled exports or data warehouses
- 42% of distributors cite keeping pace with demand as their top revenue challenge
- Inventory carrying costs range from 20% to 30% of inventory value, making live stock visibility a cash-flow issue
- Centerprism's PrismView requires no separate database and can be installed and running the same day
- Only 20% of enterprise decision-makers use traditional BI tools weekly—embedded ERP analytics puts live data in front of daily users, no BI training required
What Is Real-Time Analytics in an ERP System?
Live Data vs. Yesterday's Snapshot
In a traditional ERP setup, reporting works like this: data gets extracted on a schedule, exported to a spreadsheet, and reviewed later. By the time someone acts on it, the numbers reflect conditions that no longer exist.
Real-time ERP analytics works differently. It draws directly from the live transaction database—the same database recording every order, invoice, inventory movement, and payment as it happens. No export step, no sync delay, no separate data warehouse required.
A purchasing manager checking stock levels at 9 AM sees the same number a warehouse associate sees at that exact moment—not last night's batch run.
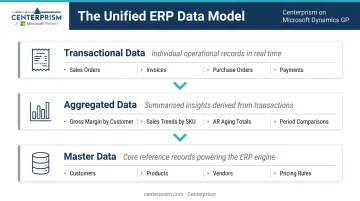
The Three Data Types That Power ERP Analytics
A well-integrated ERP system combines three distinct data types. Keeping them unified in one platform is what stops departments from pulling different numbers and reaching different conclusions:
- Transactional data — individual sales orders, invoices, purchase orders, and payments as they occur
- Aggregated data — summarized views like gross margin by customer, sales trends by SKU, or AR aging totals
- Master data — foundational reference records (customers, products, vendors, pricing rules) that give transactions consistent meaning across every report
When these data types live in separate systems—or worse, separate spreadsheets—every Monday morning meeting starts with someone arguing about whose numbers are right. A unified ERP makes that argument disappear before it starts.
The Generational Shift in ERP Reporting
Legacy ERP systems delivered reports through scheduled batch exports. Analysts would download data, manipulate it in Excel, and circulate a static file. The Distribution Strategy Group notes that B2B distribution analytics is moving from this static historical model toward predictive, real-time dashboards—and that mobile-friendly dashboards have measurably improved adoption at distribution companies.
The shift is architectural. Modern systems connect analytics directly to the operational database, so a dashboard isn't a report that was generated—it's a live window into what's happening right now.
The Hidden Cost of Delayed Data for Distributors and Wholesalers
Data Lag Shows Up in Concrete Ways
The cost of stale data isn't abstract. Consider three scenarios that play out regularly in distribution operations:
- A sales rep quotes a price on a product that was repriced two days ago
- A buyer reorders an item that's been sitting unsold for six weeks, undetected in a static inventory report
- A credit manager misses a collections follow-up because AR aging data is a week old—and the customer's balance climbs further
Each of these is a recoverable mistake in isolation. They compound fast. According to Gartner, poor data quality costs organizations at least $12.9 million per year on average—and distribution environments, where transaction volume is high and margins are thin, feel that cost acutely.
Spreadsheet Dependency Creates Compounding Errors
When two team members pull the same data at different times and get different numbers, the result is conflicting decisions, not just confusion. One buyer orders more inventory based on a Tuesday export. Another team member is working off Monday's numbers.
In surveys of distribution operations, 42% of distributors identified the inability to keep pace with growing sales as their top source of missed revenue—with lack of real-time visibility as the root cause.
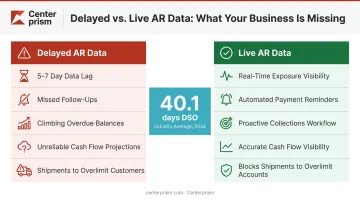
The Receivables Risk Is Especially High
When AR aging data isn't live, overdue accounts slip through. Cash flow projections become unreliable. And a customer who's already past their credit limit may receive another shipment before anyone notices.
The Hackett Group reported that DSO reached 40.1 days in 2024 among large U.S. companies, with working capital metrics worsening across the board. For distributors operating on tight margins, even a few extra days of uncollected receivables creates real cash flow pressure. Live AR data functions as a collections management tool, not just a reporting upgrade.
How Real-Time ERP Analytics Transforms Core Business Operations
Inventory and Purchasing Visibility
MDM reports that inventory carrying costs range from 20% to 30% of inventory value for distributors. That makes real-time inventory visibility a direct working capital issue, not just an operational convenience.
With live inventory data, buyers can see exactly what's in stock, what's on order, and what's actually selling—without running a report first. The practical benefits:
- Catch slow-moving SKUs before they become dead inventory
- Spot velocity trends before stockouts affect fulfillment
- Base reorder decisions on actual sell-through rate rather than periodic batch data
Purchasing data updates in the same view. Buyers can track open POs, monitor expected lead times, and flag potential shortfalls before they create customer service problems—all from one dashboard rather than emailed spreadsheets.
Financial Performance and Margin Monitoring
Thin margins are the defining constraint of distribution. Catching a 2% margin erosion in week one of the month is recoverable. Catching it at month-end close is not.
Real-time financial dashboards give managers an up-to-the-minute view of:
- Revenue and COGS by product, customer, or sales channel
- Gross margin performance at the SKU or category level
- Gross margin trends compared to prior periods—side by side, in real time
Centerprism's PrismView enables exactly this through its Sales Activity Dashboard, which supports item-based, customer-based, salesperson-based, and vendor-based margin views. Users can sort, group, and filter any field instantly without downloading data or running a new report. A built-in split-screen feature lets managers compare current performance against the prior year without toggling between tabs.
The same real-time logic applies to AR. With live aging data, a credit manager can see current exposure, set automated reminders, and address problem accounts before they age further—instead of reacting to a weekly report after the fact.
Sales Trends and Customer Insights
Real-time sales analytics changes what a sales team can do before a customer call. Instead of reviewing last week's numbers, a rep can see current buying history, recent order patterns, and which products a customer hasn't reordered—information that turns a routine check-in into a targeted conversation.
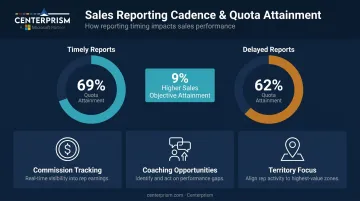
For sales managers, live performance data means:
- Identifying coaching opportunities without waiting for month-end reconciliation
- Shifting territory or product focus based on what's actually happening now
- Showing reps their commission attainment in real time, not after payroll runs
The Sales Management Association found that firms distributing sales and compensation reports in a timely way achieve 9% higher sales objective attainment—69% quota attainment versus 62% where reports aren't timely. When reps can see where they stand today, they close the gap before the month ends—not after it does.
Must-Have Features in an ERP with Real-Time Reporting
Not all ERP reporting capabilities are equal. These are the features that separate operationally useful systems from ones that still require a download to get anything done.
Live Dashboards with No Separate Database Required
The most effective real-time analytics tools connect directly to the live transaction database—no ETL processes, no data warehouse, no manual exports. The moment a transaction posts, the dashboard reflects it.
Centerprism's PrismView is built on exactly this architecture: a direct, real-time connection to the Microsoft Dynamics GP database with no additional database infrastructure required. Because there's no separate BI database to configure or populate, it can be installed and operational on the same day—a practical advantage for distributors who can't absorb months of implementation disruption.
Drill-Down Capability
A dashboard metric is only useful if you can get to the data behind it. When gross margin drops for the week, the follow-up question is always the same: which customers, which SKUs, which transactions caused it.
Drill-down capability lets a manager move from a summary metric to the underlying transactions in seconds, without exporting data or submitting a report request to IT. This is what turns a dashboard from a display screen into an actual analysis tool.
Customizable Reports by Role
A sales manager, a credit manager, and an operations director all need different cuts of the same data. A strong ERP reporting system lets each user configure their own views without IT involvement.
PrismView's Field Chooser™ allows end users to select, arrange, and filter data fields on demand. Centerprism's Sales Activity Dashboard supports multiple view types that any user can configure without spreadsheet workarounds or report queue delays:
- By item
- By customer
- By salesperson
- By vendor
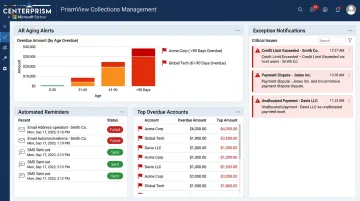
Alerts and Exception-Based Reporting
Real-time dashboards show you what's happening now. Alerts catch problems you weren't actively watching for.
Exception-based reporting means the system flags anomalies proactively, such as:
- A customer's order volume drops sharply
- A product margin falls below threshold
- An invoice crosses a collections trigger
Centerprism's collections management module provides automated reminders and alerts tied to AR aging rules, so overdue accounts don't fall through the cracks.
Best Practices for Maximizing Your ERP Analytics
Having real-time analytics available and actually using it daily are two different things. A few practices separate teams that extract full value from their ERP from those that revert to old habits.
Replace the Monday morning spreadsheet ritual. The weekly "sales email" is a cultural artifact of batch reporting. When a shared real-time dashboard is available, that ritual becomes unnecessary—and replacing it with a live dashboard review shifts decision-making from reactive to current.
Prioritize data quality at the point of entry. Real-time analytics is only as accurate as the data being entered. Distribution Strategy Group notes that predictive analytics requires clean historical sales data, accurate inventory records, and consistent product hierarchies—the same standards that make real-time operational reporting reliable. Centerprism's pricing modules and rule-based Sales Configurator enforce structured data entry, reducing the input inconsistency that corrupts downstream reports.
Choose a system with a realistic implementation timeline. Gartner forecasts that by 2027, more than 70% of recently implemented ERP initiatives will fail to fully meet original business-case goals. A system that takes months to configure before delivering any analytics value puts you squarely in that category.
For distributors running live operations, a platform that activates on day one—like Centerprism's same-day plug-and-play model—means the analytics benefit starts immediately, not after a prolonged transition.
Frequently Asked Questions
What is an ERP system in data analytics?
An ERP system in data analytics refers to the built-in capability of an ERP platform to collect, process, and surface business data—sales, inventory, financials—through dashboards and reports. It enables decision-makers to act on live operational insights rather than static exports or end-of-period summaries.
What types of reports does an ERP system generate in real time?
Common real-time ERP reports include inventory status, AR aging, sales performance by product or customer, gross margin by SKU, order fulfillment status, and salesperson activity dashboards. The specific reports available depend on the system and how modules are configured.
How does real-time ERP data improve decision-making for distributors?
Real-time data lets distributors catch margin erosion as it happens, respond to inventory shortfalls before they affect customer orders, and identify top-selling products without waiting for period-end reports.
What is the difference between ERP reporting and business intelligence?
ERP reporting delivers operational data from within the ERP system itself. Business intelligence typically aggregates data from multiple external sources for broader strategic analysis. Modern ERP systems increasingly blur this line by embedding BI-style dashboards and analytics natively—eliminating the need for a separate BI platform.
Can a small wholesale or distribution business benefit from ERP analytics?
Smaller distributors often benefit most. They lack large analytics teams and need systems that surface insights automatically. Real-time dashboards replace manual spreadsheet analysis and allow lean teams to make fast decisions without dedicated data staff.
How quickly can a distributor get real-time analytics up and running with an ERP?
It varies widely. Traditional ERP implementations can take 15 months or more. Purpose-built solutions like Centerprism, which require no separate database infrastructure, can be installed and operational the same day.