Most ERP systems aren't the problem. They collect enormous amounts of data — every order, payment, inventory movement, and sales transaction. The problem is that data sits locked inside the system, unavailable until someone exports it, reformats it, and turns it into a report. By then, it's already old.
That gap between having data and using it is exactly where business intelligence comes in. This article covers the concrete benefits of BI in ERP and how distributors and wholesalers are applying it to run tighter, more profitable operations.
Key Takeaways
- BI in ERP turns raw transactional data into live dashboards that non-technical users can act on immediately
- Real-time sales visibility lets managers course-correct during a quarter, not after it ends
- Spreadsheet-based reporting introduces errors and delays that compound across every team relying on that data
- Rep performance tracking, inventory optimization, and AR monitoring are the highest-value use cases because each one ties directly to revenue generation or cash recovery
- ERPs with native BI like Centerprism's PrismView connect directly to your existing data — no separate database, no lengthy setup, operational the same day
What Is Business Intelligence in ERP?
Business intelligence in ERP is the analytical layer that turns transactional data — orders, inventory, payments, sales activity — into visual reports, dashboards, and trend analyses that non-technical users can read and act on.
The distinction matters. ERP handles the operational work: processing orders, recording transactions, managing inventory. Business intelligence handles the analytical layer: spotting patterns, tracking KPIs, surfacing forecasts. The two work best when connected inside a single platform — because the moment data travels between separate systems, it loses freshness.
More practically, BI is a means to outcomes — not a feature to check off. A dashboard showing gross margin by SKU only matters if a sales manager uses it to catch a margin-eroding trend before it damages the quarter.
The same logic applies to rep performance views, inventory turns, or any other metric: the value lives in the decisions the data enables, not in the dashboards themselves.
Key Benefits of Business Intelligence in ERP
The benefits below connect directly to metrics that distribution and wholesale businesses track daily — not abstract capabilities, but operational impact.
Real-Time Sales Visibility and Performance Tracking
BI connects directly to the ERP's transaction database, so as orders are placed, dashboards update in real time. Sales managers and owners get a live view of what's selling, who's selling it, and at what margin — no exports, no waiting for month-end reports.
Why it matters:
- Delayed reporting forces reactive decisions. By the time a printed report surfaces a problem, days or weeks of revenue opportunity may be gone
- According to a 2023 distribution industry survey by MDM and White Cup, 92% of distributors agree analytics is vital for growing and closing sales pipelines — yet most still rely heavily on spreadsheets to generate that visibility
- Catching a margin-eroding trend early protects profitability; spotting a top-performing rep's approach creates something you can replicate across the team
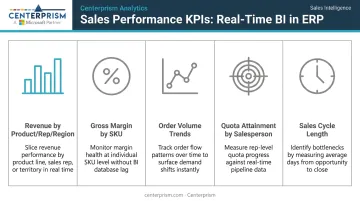
KPIs impacted: Revenue by product, rep, and region; gross margin by SKU; order volume trends; quota attainment by salesperson; sales cycle length
This benefit is highest-impact for businesses with multiple sales reps, multiple product lines, or seasonal demand patterns — where real-time course correction determines whether a quarter hits or misses.
Smarter Inventory and Demand Forecasting
BI analyzes historical order data from the ERP to reveal buying patterns, inventory turnover rates, and reorder signals — translating that data into proactive purchasing decisions rather than emergency reorders and last-minute scrambles.
Purchasing teams can see which products move fast, which sit idle, and when demand spikes typically occur — giving them foresight to act before shelves run empty or overstock capital becomes dead weight.
Both outcomes are costly in different ways:
- Stockouts lose sales and damage customer trust, often permanently
- Dead inventory ties up working capital that could fund growth elsewhere
- Inventory carrying costs typically run 15% to 25% of inventory value — meaning slow-moving stock isn't just a storage problem, it's a cash flow problem
BI makes the patterns visible before they become problems. When purchasing is driven by data rather than gut feel or last year's order history, businesses can right-size inventory levels and reduce carrying costs without sacrificing service levels.
KPIs impacted: Inventory turnover rate, days inventory outstanding, stockout frequency, dead stock as a percentage of total inventory, reorder accuracy
This benefit is most critical for distributors managing hundreds or thousands of SKUs across multiple product categories. Manually tracking demand patterns at that scale isn't just inefficient — it's impossible to do accurately.
Eliminating Spreadsheet Dependence and Accelerating Decisions
The manual process of exporting ERP data into spreadsheets, reformatting it, and building reports is slow, error-prone, and unnecessary. BI replaces that entire workflow with live dashboards any authorized user can access directly.
Instead of an analyst pulling data, building pivot tables, and emailing a report, BI delivers pre-built and customizable dashboards directly inside the ERP. A sales manager can answer "What are my slowest-moving products this quarter?" in seconds, not hours.
The spreadsheet problem is worse than most organizations admit:
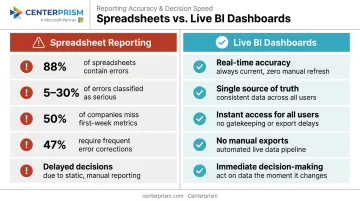
- Ventana Research found that 88% of spreadsheets contain errors, with 5% to 30% classified as serious
- 50% of benchmarked companies couldn't provide metrics within the first business week after month-end
- 47% of organizations report spreadsheet errors must be corrected often or very often after sharing
Each hour spent building a report manually is an hour not spent selling, managing, or improving operations. Beyond time, there's an accuracy problem: when different people pull data at different times, leadership ends up debating whose numbers are right instead of deciding what to do.
When everyone pulls from the same live source, that debate disappears.
KPIs impacted: Time spent on recurring report generation, data latency, report accuracy rate, number of manual data exports per week
This advantage is most pronounced in businesses where operations managers, sales leaders, and owners all need answers from ERP data but lack technical skills to query the system directly — which describes most distribution and wholesale businesses.
BI in ERP Use Cases for Distributors and Wholesalers
The advantages above become concrete in day-to-day operations. Here's how distribution and wholesale businesses apply BI within their ERP.
Sales Rep Performance and Commission Management
A distribution business with multiple sales reps uses BI dashboards to track each rep's revenue, margin, and activity in real time — and uses that data to apply custom commission plans automatically rather than calculating them manually at month end.
The operational outcome:
- Managers identify underperforming reps early enough to coach them before a quarter is lost
- Top performers are recognized and rewarded accurately based on live data
- Commission errors — which damage trust and morale — are eliminated
This matters most for businesses with tiered or flexible commission structures. Centerprism's Advanced Sales Commission Module supports tiered rates, salesperson splits, paid invoice commissions, product spiffs, and a sliding depreciation scale that adjusts payouts based on the aging of a rep's past-due invoices.
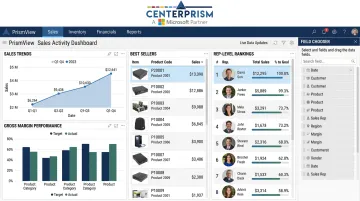
PrismView's Sales Activity Dashboard puts rep-level revenue, margin, and ranking in front of managers in real time — no spreadsheet required.
Inventory Optimization and Dead Stock Identification
A wholesale company uses BI embedded in its ERP to identify which products haven't moved in 60+ days, cross-referenced with purchasing commitments still in the pipeline — surfacing dead stock before it accumulates further.
The operational outcome:
- Purchasing teams adjust reorder quantities before committing to more of a slow mover
- Sales teams receive prompts to promote stagnant inventory through targeted outreach or pricing adjustments
- Finance gets a clearer picture of working capital tied up in inventory
All of this comes from a single dashboard without manual data pulls. A business managing 500+ SKUs can't rely on a buyer's memory or a weekly spreadsheet to catch every accumulating problem.
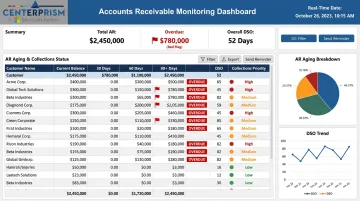
Accounts Receivable Monitoring and Collections Prioritization
A distributor uses BI dashboards within its ERP to flag overdue accounts, track days sales outstanding by customer, and prioritize collections outreach — replacing the manual process of running aging reports and deciding who to call each week.
The stakes are real: D&B's Q4 2025 AR aging report found that wholesale nondurable goods had 14.2% of AR dollars 91+ days past due, and wholesale packaged frozen goods hit 15.6% — figures that have a direct impact on cash flow and bad debt risk.
When collections teams work from live data rather than a static spreadsheet printed days ago, overdue accounts get addressed faster and warning signs surface before they become write-offs. Centerprism's built-in Collection Management System covers this end to end — automated reminders, customer communication tracking, custom status assignment, and real-time visibility through PrismView — without requiring data exports or separate reports.
What Happens When Your ERP Lacks Business Intelligence
Without BI, an ERP becomes expensive data storage. The data exists, but insights aren't surfaced — so decisions get made on instinct, lagging reports, or nothing at all.
The operational consequences follow a predictable pattern:
- Different team members pull different numbers and arrive at different conclusions — meetings stall on debating the data instead of acting on it
- Problems surface at month end or quarter end, long after the window to course-correct has closed. A stockout that BI would have flagged three weeks earlier becomes a lost customer
- Manual reporting workflows consume analyst and manager time every week. Errors in those reports lead to mis-priced orders, over-purchasing, or missed collections
- A business managing 10 SKUs and 2 reps can survive on spreadsheets. One managing 500 SKUs and 12 reps cannot
Panorama Consulting's 2026 ERP Report found that 55.3% of organizations deployed BI specifically to address ERP reporting delays and inconsistent metrics — and that benefit realization from removing data silos jumped from 55.2% to 77.4% when they did. When ERP data becomes actionable, that 22-point jump in realized value is the direct result.
How to Get the Most Value from BI in Your ERP
BI delivers the most value when it's embedded into daily workflows — not just reviewed during quarterly business reviews. That rhythm is what separates businesses that benefit from BI from those that have it installed and barely use it. In practice, it looks like this:
- Sales managers check dashboards before team meetings
- Purchasing reviews inventory alerts weekly
- Finance monitors receivables in real time
Setup matters as much as software. Businesses that define clear KPIs upfront — which metrics matter, who owns them, what thresholds trigger action — get ROI faster than those who install dashboards and wait for insights to emerge on their own.
That upfront clarity also makes the case for a different kind of platform choice. The fastest path to value is an ERP with BI built in rather than bolted on. A separate BI platform means integration complexity, data latency between systems, and additional licensing costs — and typically weeks or months before the system delivers anything useful.
Purpose-built ERP solutions for distributors and wholesalers close that gap. Centerprism's native PrismView analytics connects directly to the Microsoft Dynamics GP database in real time — no separate data warehouse, no synchronization lag.
The Sales Activity Dashboard surfaces sales trends, best sellers, margin performance, and rep-level rankings out of the box, with the Field Chooser™ tool available for further customization. Because no additional database is required, implementation is same-day. Businesses spend less time configuring and more time acting on the data.
Conclusion
The value of BI in ERP comes down to three things: control over sales performance, clarity on inventory and margins, and consistency in how decisions get made across the business.
The advantages compound. A business that acts on real-time sales data this quarter builds better forecasts next quarter. One that monitors receivables weekly reduces bad debt over the year. One that catches dead stock early frees up working capital that funds growth.
Treating BI as an operational practice — not a reporting tool you check occasionally — is what separates distributors who react to problems from those who prevent them. The payoff comes when real-time visibility shapes daily decisions, not just end-of-month reviews.
Frequently Asked Questions
What is ERP in business intelligence?
ERP is the operational backbone that collects and stores business transaction data — orders, inventory, financials, payments. BI is the analytical layer that turns that data into dashboards, reports, and trend analyses.
What are the five ERP modules?
While module names vary by vendor, the five core ERP modules typically include finance and accounting, supply chain and inventory management, sales and order management, human resources and payroll, and customer relationship management (CRM). BI connects across all of these to surface insights in one place.
How is business intelligence different from standard ERP reporting?
Standard ERP reporting produces fixed outputs — invoices, aging reports, transaction logs — designed for operational recordkeeping. BI enables flexible, interactive analysis, allowing users to explore trends, compare time periods, and drill into performance without IT support or data exports.
Can BI in ERP replace spreadsheet reporting for distribution businesses?
Yes. When BI is embedded in or tightly integrated with an ERP, it replaces manual Excel-based reporting with live dashboards that update automatically — eliminating version control issues, reducing errors, and saving significant time each week.
What are the most valuable BI use cases for wholesalers and distributors?
The highest-value use cases are real-time sales rep performance tracking, inventory turnover and dead stock identification, and accounts receivable monitoring. Each connects directly to revenue, cash flow, and operational efficiency in distribution businesses.
How quickly can a business start using BI insights after ERP implementation?
It depends on whether BI is built into the ERP or added separately. ERPs with native analytics — like Centerprism with PrismView — deliver analytics immediately after installation, with no separate database setup required. Businesses integrating a separate BI platform typically need weeks to months to configure data connections, define metrics, and train users.